Signals
A signal is a category of telemetry data. The three most-used signals in OpenTelemetry today:
Each signal has its own exporter and provider. The OpenTelemetry specification also defines baggage as a signal, with events and profiles in development — see the OpenTelemetry signals documentation for the current full set. Arize AX focuses on traces, since traces are what make AI application behavior legible.
Span Structure
A span is a structured log representing a single unit of work — one LLM call, one tool invocation, one retrieval. It’s the atomic unit of a trace, and it carries everything you need to understand what happened:
For the canonical specification, see Span Structure.
Spans, Traces, and Sessions
Spans, traces, and sessions form a three-level hierarchy. The analogy that often helps:A session is a conversation. A trace is one turn — one user input, one bot output. The spans inside the trace are the steps that produced that output.
Span
The individual step the application takes. Spans can be nested viaparent_id:
- Child span —
parent_idequals the span ID of another span in the same trace. - Root span —
parent_idisnull. The top of the tree. - Orphan span —
parent_idreferences a span that doesn’t exist in the project. Usually a sign of incomplete instrumentation or context propagation gone wrong.
Arize AX UI behavior: Arize AX reads the trace-level input and output from the root span. If those columns are empty on the root, the trace list shows blank I/O — even when child spans have data. Configure source mapping or set
input.value / output.value on the root during instrumentation. This matters most for manually built traces; auto-instrumentors usually work without custom mapping.Trace
A collection of spans sharing the sametrace_id. One trace represents the end-to-end work for a single request — a single user turn in a chat, a single API call, a single agent run.
Session
A collection of traces sharing the samesession.id. A session typically represents a multi-turn conversation — every user message and every bot response across that conversation is its own trace, all linked together by a shared session ID.
You set session.id on your spans either:
- via the
using_sessioncontext manager, or - by setting the
session.idattribute directly on each span.
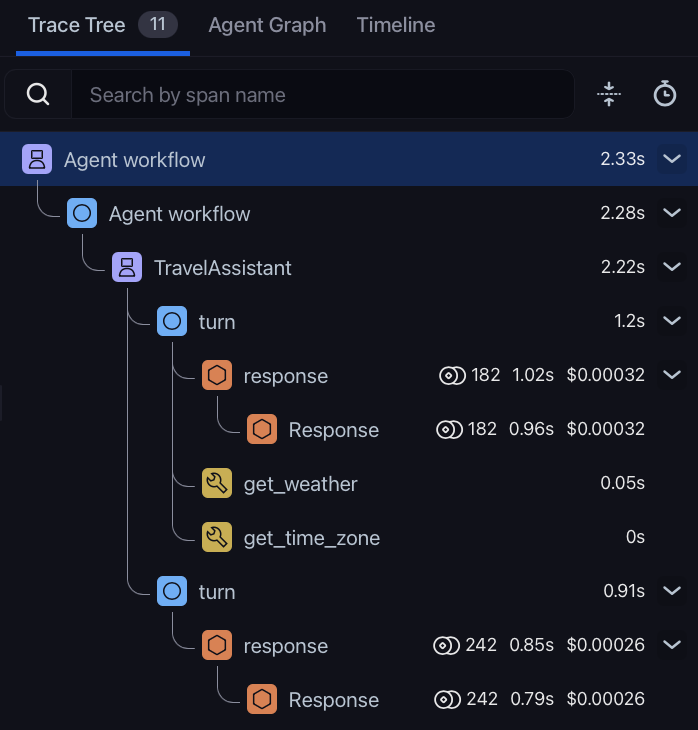
How They Fit Together in a Trace
In a typical AI application, a single user turn might produce a trace that looks like this:parent_id references, and the Arize AX UI renders it visually so you can drill into any span to see exactly what happened.